Our latest analysis presents insight into color choice for television commercials and video content in the automotive sector. Leveraging our proprietary AI technology, we’ve analyzed over 10 million television commercials & video assets to bring you critical findings.

In the ever-evolving landscape of automotive marketing, choosing the right car color for TV commercials and video assets is crucial. Videoquant’s recent analysis reveals fascinating insights into which car colors drive the best performance in automotive advertising. This article delves into these findings, discussing cars and trucks separately due to their distinct results.
An Unexpected Find: Trucks vs. Cars
One of the key insights that emerged early in the analysis is that cars & trucks must be considered separately , as the colors used in car vs. truck TV commercials and videos appear to yield statistically different results.
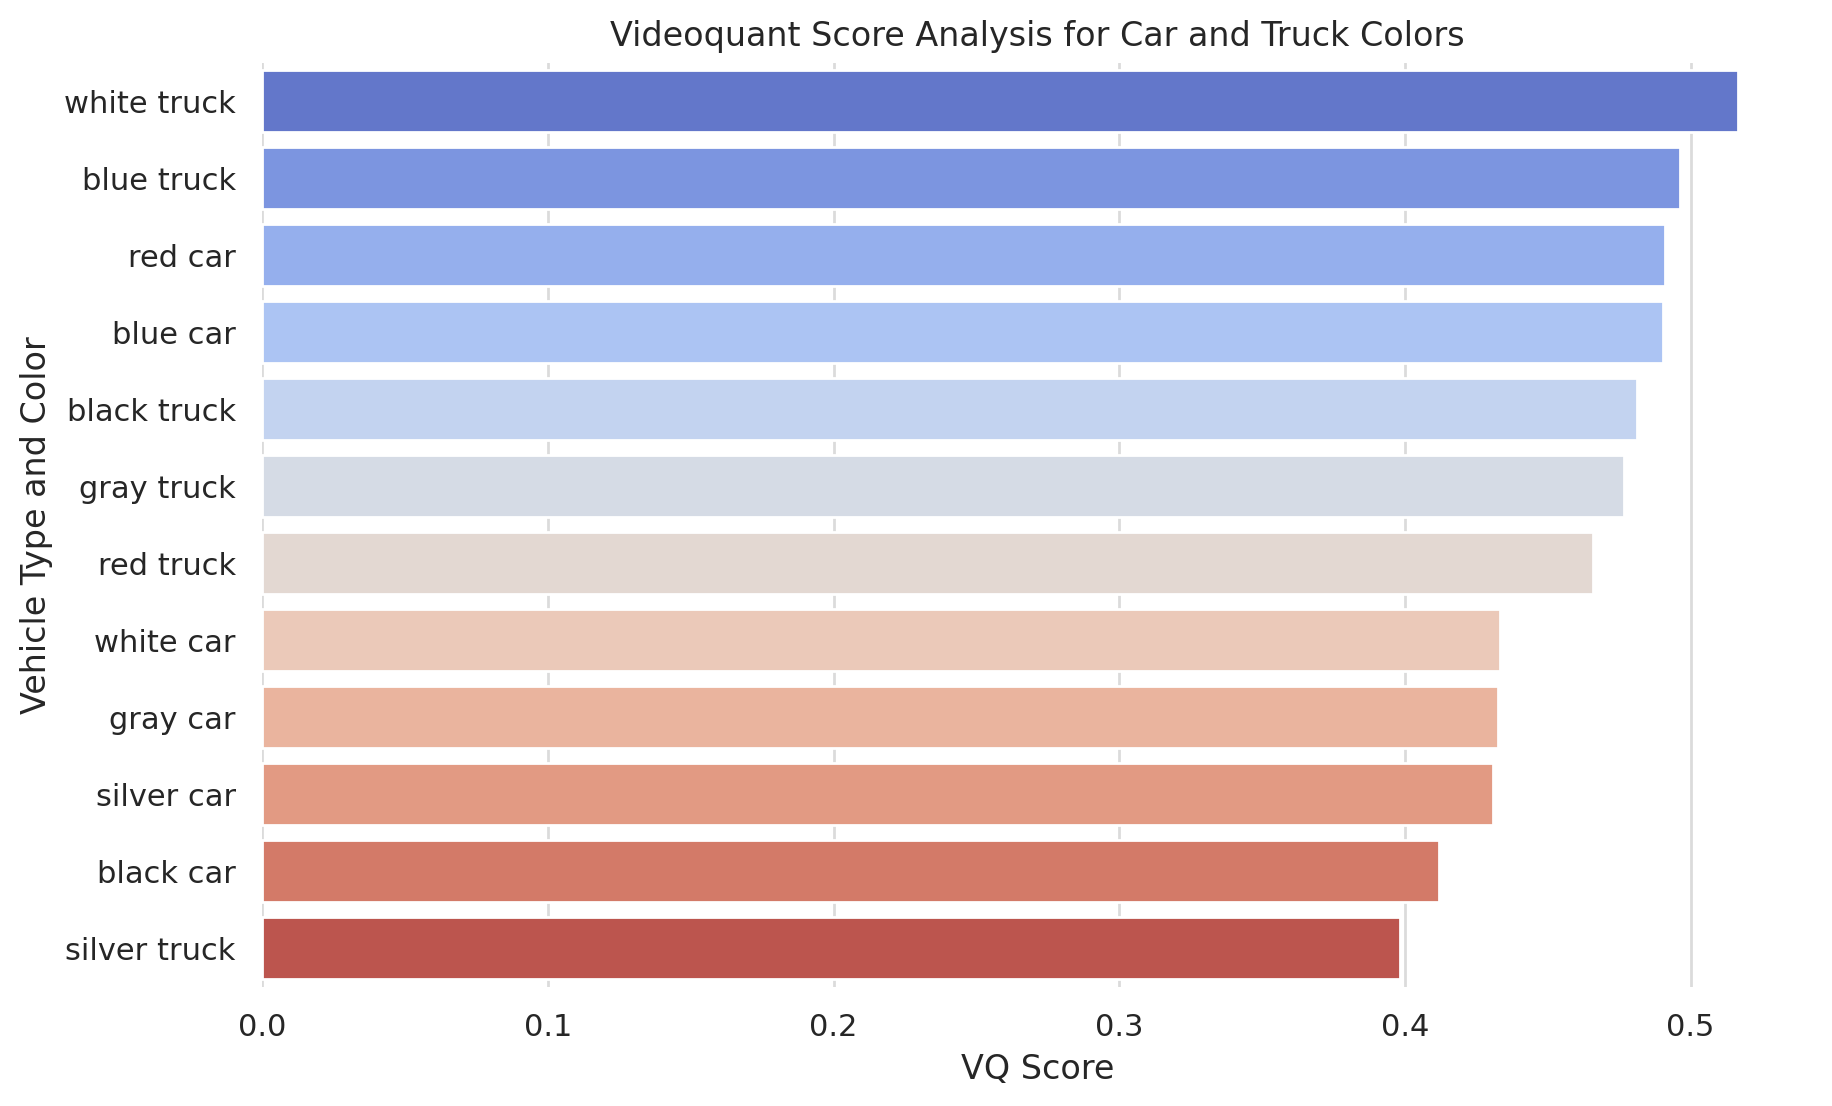
Perhaps equally as interesting, Videoquant’s data presents a case for prioritizing trucks over cars in US TV/video advertising, particularly when budget constraints demand a choice between the two. The analysis reveals that, generally, truck video assets (mean VQ score of 0.446), outperform car assets (mean VQ score of 0.435) in terms of audience engagement and potential return on investment. Trucks, with their diverse range of appeal, showed moderately consistent higher VQ scores compared to their car counterparts. This trend suggests that consumers may resonate more with truck content, possibly due to perceived utility, ruggedness, or lifestyle associations.

Cars: A Tight Race Led by Red and Blue
The car category presents a tighter competition among colors. Red cars and blue car yielded near-identical results at a VQ score of 0.49. This near statistical tie indicates that both colors are almost equally effective in engaging audiences in automotive commercials to drive ROI.
Other notable colors include white cars (0.43) and gray cars (0.43), both showing moderate performance. Silver cars, similar to trucks, are less effective with a score of 0.43. The least performing color for cars is black, scoring 0.41, which contrasts with its relatively better performance in the truck category.
Trucks: The Dominance of White
The analysis shows a clear preference for certain truck colors, with white trucks leading at a Videoquant (VQ) score of 0.52. This score, closest to the ideal 1.0 mark for highest probability of ROI success, suggests that white trucks resonate most effectively with audiences. Following closely are blue trucks with a score of 0.50.
Interestingly, the results for trucks show a diverse range of colors performing well, though none reaching the pinnacle of white. Black trucks (0.48), gray trucks (0.48), and red trucks (0.47) also show strong performance, though not as impactful as white or blue. Silver trucks lag at the lower end with a score of 0.40, suggesting less audience engagement.
Key Takeaways
- Color Specificity Matters: The distinction between cars and trucks is crucial. What works for one does not necessarily translate to the other.
- Cultural and Contextual Factors: The preference for certain colors might be influenced by cultural, societal, and contextual factors, an area worth exploring for marketers.
- Integrating Insights into Strategy: These insights from Videoquant can significantly impact marketing strategies. Brands can leverage this data to tailor their content, ensuring higher engagement and ROI.
What Is The VQ Score?
The Videoquant (VQ) score is an innovative metric developed by Videoquant to evaluate the effectiveness of video contenin the realm of TV/video advertising and marketing. This score ranges from 0 to 1, where a score closer to 1 indicates a higher likelihood of viral success and a strong return on investment (ROI). Conversely, a score closer to 0 suggests no audience engagement and no effectiveness. The VQ score is calculated using an AI algorithm that analyzes over 10 Million TV commercials and video assets across a large array of data points. This analysis includes patterns of viewer engagement, visual elements, and thematic content, among other factors. By leveraging this data-driven approach, Videoquant’s VQ score provides a predictive measure of a video’s potential impact, enabling creators and marketers to make more informed decisions and optimize their content for maximum audience resonance and commercial success.
Conclusion
Videoquant’s analysis offers a nuanced understanding of the impact of car colors in automotive commercials. While white and blue dominate in trucks, cars present a more varied landscape with blue and red at the forefront. For marketers and advertisers in the automotive sector, these insights are not just numbers but strategic tools to craft compelling and successful campaigns.