U.S. Patented & Super Bowl Validated

Moneyball for ads.

Most ads lose money. Our AI knows which ones, before you spend. Up to 81% lower CAC.

Direct MailTV / CTVMeta

See case studies by channel

Free proof of concept · ~1 hour

Prove CAC reduction on your data today.

We work with teams at

All Response MediaDraftKingsPeerspaceUberErie HomeTinuitiMeasured.comOllie Pet FoodCaribouLennarOnCourseAll Response MediaDraftKingsPeerspaceUberErie HomeTinuitiMeasured.comOllie Pet FoodCaribouLennarOnCourse

Protected by U.S. Patent No. 12,020,279.
Others make claims. We have IP.

01

Why is my CAC so high?

You're optimizing media. But 70% of the outcome is creative, and nobody manages its P&L impact.

02

Why is testing so slow and expensive?

Each test takes weeks and burns budget. Videoquant takes seconds, before you spend.

Why I Built Videoquant
Tim D'Auria, Founder of Videoquant
"I wasted $100M+ on ads, paying 2x a competitor's CAC on identical media, all because of creative. I felt like crying. That's why I built Videoquant."
— Tim D'Auria, ex-Bloomberg Quant, ex-Tripadvisor TV Head ($100M+/year spend)
Where it started

Ad creative drove 2× more growth per dollar…

for my competitor!(oh that's nice)

When I led TV at Tripadvisor, we could run the exact same media plan and flighting as a rival. Yet they'd get roughly 2× the lift per media dollar. Root cause: creative.

My vs. Competitor TV Lift (on Identical Media Plan)

My vs. Competitor TV LiftBoth lines stay near baseline until a few seconds after the TV spot at time zero, then rise and decay. The competitor peak is higher, and the competitor line falls back toward baseline more gradually than my TV ads line.10008006004002000TV LiftCompetitor's TV adsMy TV adsSeconds elapsed from TV ad start

Illustrative TV-caused lift vs. seconds from spot start (0 = airtime; response onset ~5 s with exponential decay tail). Competitor clears roughly 2× the peak lift I saw on identical media.

Put another way:creative cost $40M in media inefficiency.

This chart hangs on my wall as a reminder of why Videoquant exists.

The Problem
76% of ads don't break even... because of creative

70% of ad outcomes are driven by creative (Google Research). Yet most teams still guess, causing CAC bloat. Super Bowl advertisers like DraftKings and Uber use Videoquant to move 100x faster using outcomes data, not opinions. Read the case studies.

How brands decide where to spend on creative today
🎯
Gut Instinct
Subjective
🗣️
Opinions & HiPPOs
Biased
📊
Post-Launch Data
Too Late, Too Little, Too Expensive
The Videoquant Fix
Predict which ads will perform — before you spend.

Our AI analyzes behavioral data from 200M+ adults to predict creative performance in seconds, not weeks.

💵
Revenue
Sales lift
👤
Acquisitions
New customers
📱
App Downloads
Install rate
📈
Brand Lift
Awareness
Engagement
Interaction rate
🎯
Your KPI
Custom metrics
The ROI Mechanism
Simple capital allocation for creative.

Score your creative before you spend. Put more money behind high scores, less behind low ones. It's that simple. See how it shows up in client results.

📈
Spend More
on high-scoring creative
📉
Spend Less
on low-scoring creative
Who It's For
Every media dollar pays the 'Creative Gamble Tax'.

Four teams get impacted by one blind spot.

⚠️

Marketers believe creative drives 20% of sales. Google Research measures 70%. The gap is where budgets go to die.

Select a role
Your CAC problem is creative. You just can't prove it yet.
A/B tests take weeks. Focus groups take months. And both require you to guess what's even worth testing. Videoquant tells you which creative wins — in 20 seconds — using outcomes data, not opinions.
The Pain
  • Traditional creative pre-testing: 4–8 weeks, $20K+, and you still have to guess what to put in them
  • Focus groups: 6–8 weeks, $30K+, based on what people say — not what they do
  • Post-launch data: by the time you have signal, the budget is already burned — and the creative has fatigued
The Relief
  • Score any creative — briefs, concepts, raw cuts, finished ads — in 20 seconds
  • Outcomes data from 200M+ adults and 18 trillion real interactions, not surveys
  • Enter every A/B test already knowing what wins — cut losers before they cost you
81% lower acquisition cost from creative reallocation (publicly traded Super Bowl advertiser)
p < 0.001
Proof of ConceptCase studies
Reason for Videoquant
Why Billion-Dollar Brands Trust Videoquant
Michael Strickman testimonial
"Managing billion-dollar marketing budgets requires rigorous testing. Our tests confirmed Videoquant's predictions significantly correlated with crucial downstream metrics. Videoquant's innovative approach leverages others' marketing investments to measure what works in the market before we spend."
— Michael Strickman, ex-Uber VP Performance Marketing and Growth
Why This Matters
Often the answer isn't channel. It's creative.

Most brands ask "Why didn't this channel work?" or "Why did CTV fail?" or "Why did performance drop?"

If you can predict creative performance before launch, you remove the largest source of waste in paid media. Browse case studies for channel-by-channel proof.

How It Works
20 seconds for outcomes-based insight

Not weeks for opinions or costly A/B tests.

1

Input Creative

Ideas, briefs, CTAs, visuals, or complete ads.

2

Select Audience

Choose the audience you want to test against.

3

Score + Diagnostics

See predicted results with scene, utterance, and copy-level diagnostics.

4

Incremental Lift

Spend more on high scores, less on low ones.

Teams run this workflow across direct mail, Meta, TV, and beyond — from app screenshots to offer testing and creative briefs.

Proof of ConceptCase studies
Reason for Videoquant
Tripadvisor's founder explains
Steve Kaufer testimonial
"Tim led Tripadvisor's TV advertising data science, optimizing $100M+/year in TV across 10 countries. With Videoquant, he developed a breakthrough approach and technology I wish we had back then—removing guesswork from advertising."
— Steve Kaufer, Tripadvisor Co-founder & ex-CEO of 22 years, CEO of GiveFreely
Proof of ConceptCase studies
Results
How Super bowl brands put Videoquant to the test

Full write-ups: case studies (Fortune 500 CTV, Super Bowl TV, and more).

  • Blind study done by a $60B brand spending $2B/yr on marketing.
  • VQ predictions gave 4.4x higher brand lift & ROI (p-val 0.03).
  • $240K savings per $1M spent on TV.
  • In a two-year enterprise engagement, one client saw an estimated $20M+ in incremental value on a $330K annual investment. Discounting that estimate by 95% still yields a 3x return.
Fortune 500 Test Results
Practice areas
We focus on three channels

Direct mail, TV, and Meta — same prediction engine, tuned for how each medium actually performs.

Direct Mail

  • Packages & letters — Score creative, offers, and formats before print and postage.
  • Inserts & catalogs — See predicted lift on appeals, layouts, and CTAs.
  • Lift vs. cost — Know which variants deserve house file or prospecting volume.

TV

  • Linear & CTV — Proven in large controlled tests; trusted in major TV campaigns.
  • Scene-level diagnostics — Pinpoint what helps or hurts performance.
  • Capital allocation — Put serious dollars only behind creative the model already likes.

Meta

  • Facebook & Instagram — Feed, Stories, and Reels creative scored before spend ramps.
  • Hooks & messaging — Predict which angles will move your KPI, not just win internal reviews.
  • Lower CAC — Shift budget to high-scoring assets earlier in the flight.

Same question everywhere: will this creative earn? Know before you spend. Case studies by channel.

Reason for Videoquant
What took months now takes hours
Luke Tarbi testimonial
"Within 24 hours, Videoquant delivered us the equivalent of six months of focus groups and surveys—and it was based on real-world behavior rather than opinions. It analyzed everything from our high-level strategy to granular tactics for our ads. I was amazed by the speed of insights and actionability of results."
— Luke Tarbi, CMO of Peerspace
Enterprise Case Study

Four separate teams at a publicly traded Super Bowl advertiser independently validated Videoquant predictions across TV, paid social, app store, and offer testing — without coordinating. Every test showed statistically significant results. Read the case studies.

Meet the Founder
I'm Tim D'Auria, the Founder of Videoquant.

We've mastered avoiding ad fails by using computer vision, 18 Trillion human-marketing impressions, and custom audiences.

I'm an ex-Bloomberg Wall Street Quant, former Tripadvisor Head of TV Optimization, and can be seen in talks with the C-Suites of CBS, iSpot, etc.

Tim D'Auria Founder Video
More Results
#1 Best Video for Over 1 Year. 1.4M Subscriber Channel.
  • 1.4 Million subscriber YouTube channel.
  • VQ output a concept; the channel built it.
  • #1 most-viewed video for over a year across 360 videos.
YouTube Success Image
Additional Data
Validated Across Channels

Details and methodology: cross-channel case study and related write-ups.

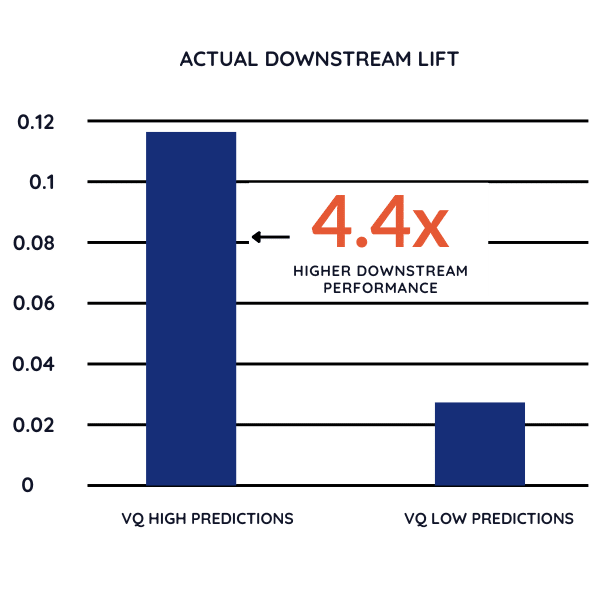
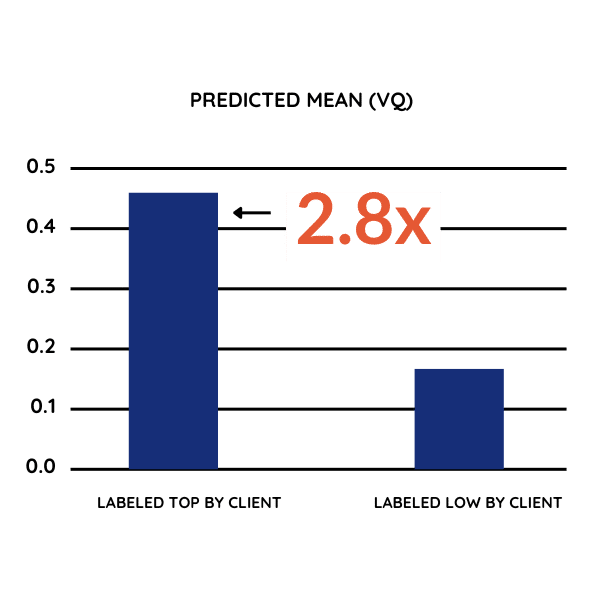
In controlled experiments across channels, Videoquant predictions held up against real-world outcomes.

  • Correctly predicted the winning creative in 3 out of 3 app store tests.
  • On offer testing, predicted winner drove 4.1x more acquisitions at 81% lower cost (p < 0.001).
  • Called 7 out of 10 paid social head-to-heads correctly.
  • VQ high predictions had higher downstream actuals on TV.
Big TV Win - VQ Predictions vs Actual
Industry Recognition
Founder with Industry Leaders
Tim w/ CBS + Roku

Tim w/ CBS + Roku

Watch CBS CAO Radha Subramanyam, VQ Founder, and others discuss television attribution.

Tim w/ CEO iSpot

Tim w/ CEO iSpot

Watch iSpot CEO Sean Muller & VQ Founder discuss a new method for TV measurement.

Tripadvisor ex-CEO

Tripadvisor ex-CEO

Tripadvisor Co-Founder & ex-CEO Steve Kaufer Joins Videoquant

Before media dollars are committed
Know what works before you spend.

Seconds, not weeks. Data, not opinions.

Proof of ConceptCase studies
videoquant.ai
Direct mail, Meta & TV — know what works before you spend